Command Center Dashboard
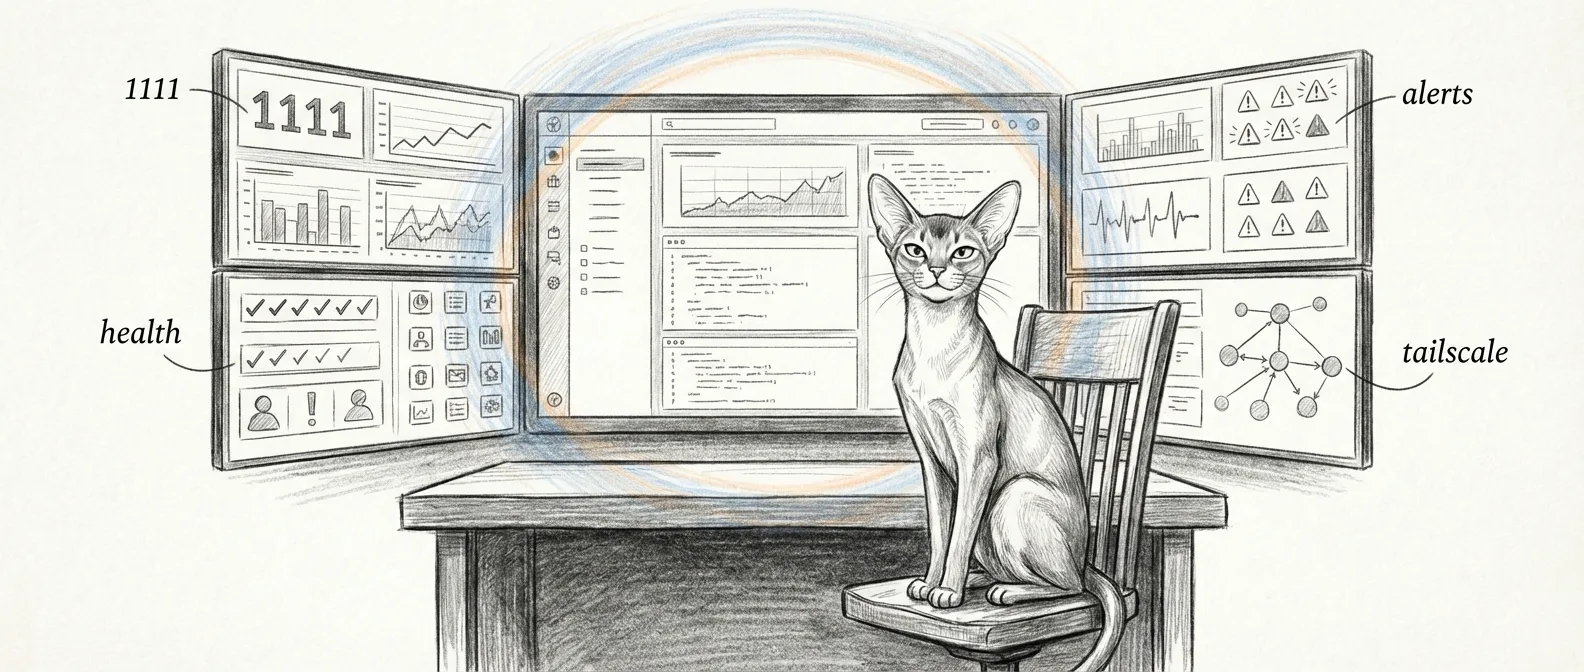
Every haus has a thermostat. This haus has a mission control. The command center dashboard is the primary interface for monitoring and managing a Sanctum instance — real-time visibility into service health, VM status, Docker containers, and network peers, all rendered in a browser window that your spouse will never voluntarily open.
The root shell at http://localhost:1111/ serves the Command Center React app directly — the page title is … Command Center, not a chat window. The backend can swap in a Jocasta chat shell at / when a jocasta.html sits next to the running server, but the shipped build doesn’t include one, so you get the dashboard. The operational data lives behind the same backend on /api/*.
If you want the same core surfaces in a native macOS shell instead of a browser tab, see the Holocron App. Same Sanctum, less tab sprawl, slightly higher expectations.
Architecture
Section titled “Architecture”The dashboard runs a Vite + React frontend served by an Express backend on port 1111, bound on all interfaces. You reach it directly at http://manoir.local:1111/ (or by IP). The number of layers involved in showing you a green dot is, frankly, unreasonable.
There’s also a :80 reverse proxy in the haus, but it does not front the command center. The com.sanctum.dench-proxy Node LaunchDaemon forwards port 80 to the Holocron renderer on :19001, with a hostname rule sending force/flow.* to Force Flow on :4077. The dashboard is not in that path.
Browser → http://manoir.local:1111  → Express backend (:1111) → Vite/React frontend
Browser → http://<host> (:80) → com.sanctum.dench-proxy (Node) → :19001 (Holocron) → :4077 (Force Flow, if host starts force/flow)Dashboard Panels
Section titled “Dashboard Panels”The dashboard polls each data source independently. It’s like having a handful of tiny air traffic controllers, each watching one runway and none of them talking to each other.
Service Health
Section titled “Service Health”Probes a fixed roster of Mac services — Home Assistant, Firewalla Bridge, XTTS, Voice Agent, MLX Council, Codestral, Kiwix, Outline, and Docker Desktop — by opening a TCP socket on each port. The result is binary:
- Up — the port accepted a connection
- Down — connection refused, timed out, or the port is closed
No degraded-yellow or disabled-grey state lives in the backend yet; a port either answers or it doesn’t. You will still develop a Pavlovian relationship with that one color.
VM Status
Section titled “VM Status”Shows the Ubuntu VM state by SSHing into the guest (it’s Lima-managed — services.lima.instance: sanctum-vm) and running free -m, df -h /, uptime -p, and docker ps. So: memory, disk, uptime, and the in-guest container list — reported by the guest itself, not by the hypervisor.
Docker Containers
Section titled “Docker Containers”Lists the names of running Docker containers on the Mac (docker ps --format '{{.Names}}'). Names only — image, ports, and resource stats aren’t surfaced yet.
LaunchAgents
Section titled “LaunchAgents”Reports the loaded/running state of a curated list of Sanctum-managed LaunchAgents (watchdog, Firewalla bridge, voice agent, MLX server, the dashboard itself, and friends) as a simple up/down per label.
Tailscale Peers
Section titled “Tailscale Peers”Renders the Tailscale peer list — each device’s name, IP, OS, and online status — straight from tailscale status.
Alerts
Section titled “Alerts”Shows non-dismissed alerts with their severity (info, warn, error, critical), source, message, and timestamp. Alerts are dismissed directly from the panel — there’s no separate acknowledged-but-still-showing state; dismiss removes it from the active list.
API Endpoints
Section titled “API Endpoints”The Express backend exposes several endpoints consumed by the frontend and available for external tooling.
GET /api/health/status
Section titled “GET /api/health/status”Returns a single snapshot of everything the panels render — one object, six top-level keys.
{ "macServices": [{ "name": "Home Assistant", "status": "down", "port": 8123 }], "vm": { "reachable": true, "memory": "1895/7922MB (23%)", "disk": "15G/96G (16%)", "uptime": "up 1 day, 10 hours, 9 minutes", "containers": ["openclaw-sbx-agent-main", "neo4j"] }, "dockerContainers": ["homeassistant"], "launchAgents": [{ "name": "Sanctum Watchdog", "status": "down" }], "lmstudioModels": [], "tailscale": [{ "name": "manoir", "ip": "100.0.0.5", "os": "macOS", "online": true }]}There is no top-level status or timestamp field — each panel reads its own slice and decides for itself how worried to be.
GET /api/config
Section titled “GET /api/config”Serves the instance configuration from instance.yaml with secrets excluded. Used by the frontend to determine which panels to render and how to label the instance.
GET /api/alerts
Section titled “GET /api/alerts”Returns all non-dismissed alerts as { "alerts": [...], "total": N }, newest first. It takes no query parameters — no severity filter, no time range, no limit. (GET /api/alerts/all includes dismissed ones.) To clear one, DELETE /api/alerts/:id sets dismissed: true; DELETE /api/alerts clears them all.
GET /api/health/tests
Section titled “GET /api/health/tests”Runs the council-router test suite on demand (run-suite.sh --suite all) and returns the results. Think of it as pulling the fire alarm to see if the sprinklers work. Useful, but don’t do it during dinner.
Proxied Services
Section titled “Proxied Services”The dashboard backend proxies requests to services that are not directly accessible from the browser. This is the polite way of saying “some of these services were never designed to talk to a web browser, so we put a translator in the middle.”
Firewalla
Section titled “Firewalla”Firewalla API calls are proxied by the backend to the Firewalla bridge on localhost:18094 with a bearer token. The bridge — a separate service — owns the cloud authentication handshake and the box’s local P2P connection on port 8833. The dashboard just talks to the bridge; the hard parts happen one hop further in.
Home Assistant
Section titled “Home Assistant”HA API requests are forwarded to localhost:8123 through the backend, which injects a long-lived access token (HA_TOKEN, read from the backend environment) so the browser never sees it. The token lives in the backend’s env, not the Keychain — a hardening gap we know about.
Configuration
Section titled “Configuration”Dashboard behavior is driven by instance.yaml:
services: dashboard: port: 3333 # Vite dev server backend_port: 1111 # Express backend (the one you actually hit)The backend listens on 0.0.0.0:1111 — all interfaces, not LAN-only. If you want it firewalled to the LAN, that’s the host firewall’s job, not a config flag here.
LaunchAgent
Section titled “LaunchAgent”The dashboard runs as a persistent LaunchAgent:
| Property | Value |
|---|---|
| Label | com.sanctum.dashboard |
| RunAtLoad | true |
| KeepAlive | true |
| Port | 1111 |
For the packaged desktop shell that embeds this dashboard alongside command and health surfaces, see Holocron App.